
How to Simulate How Cloud Networks Fail
Cloud networks, and most massively scaled networks, are subject to partial failures that will impact some of your application connections but not others. Congestion will lead to intermittent packet loss and is another flavor of partial impact that occurs in multi-tenant environments. How do you know if your monitoring, health checks and failure mitigations, like host removal and retry, will mitigate these kinds of failures? You test! This article will show you how you can use Linux IPTables, routing policies and network control to simulate cloud network failures.
Linux has come a long way with tooling for simulating network failures. The traffic control (tc) tool has a wonderful bag of tricks for simulating total packet loss, intermittent packet loss and delays. Tc even provides random distributions of packet loss for additional realism in testing. However, tc doesn’t support random % of network flow impacts. As a reminder, network flows are defined as a 5-tuple of ip address, ports and protocol. Each TCP connection is a flow. Cloud providers use equal cost multi-path (ECMP) routing to scale out by randomly hashing 5-tuple flows across 10s to 1000s of network ports. A failure of one device can impact some of your connections, but not others. You can read more about it in How Cloud Networks Fail. To simulate this kind of failure, we need a way to target drops/loss/delays on a random percentage of flows to simulate the way cloud networks fail.
Linux routing supports ECMP using a 5-tuple hash key. We can use this to create a special kind of router that can apply tc policies to a percentage of flows that run through the linux box. This article will step you through how to set this up for yourself.
The test architecture
My test simulates communication between a client in one subnet, and a service in another subnet. I created a simple python HTTP web service on the server side, and I’m using a python web client on the other side. Another linux host acts as a router to connect between the two subnets. The client, server and router are all AWS EC2 instances running Amazon Linux. For our testing, I want all of the traffic flowing between the client and server to hop through my router host, because we will configure the router host to inject failure between the client and server.

Setup a Linux router in AWS
1. Create instances and subnets
The first order of business is getting a simple router setup in AWS. To do this, you’ll need a VPC, two subnets in the same availability zone and three Ec2 instances. You don’t need anything fancy, I used t2.micro’s for my hosts. Our router will need a second network interface, one for each subnet. Then our client lives in one subnet, the server lives in the other. Setup a security group that allows ICMP requests as well as TCP port 80 requests, or whichever protocols you want to test.
For my examples, I’m running two subnets: 172.31.32.0/20 and 172.31.96.0/20
2. Configure the router
To set up the router, we’ll need to configure AWS and linux settings to allow the host to forward packets. This means disabling the various protections against receiving or sending packets without a matching src ip address on the router host. We will also need to update routing tables, so the router knows how to route packets between the client and server.
We will start with AWS configuration. Go into the AWS console and disable src ip filtering.
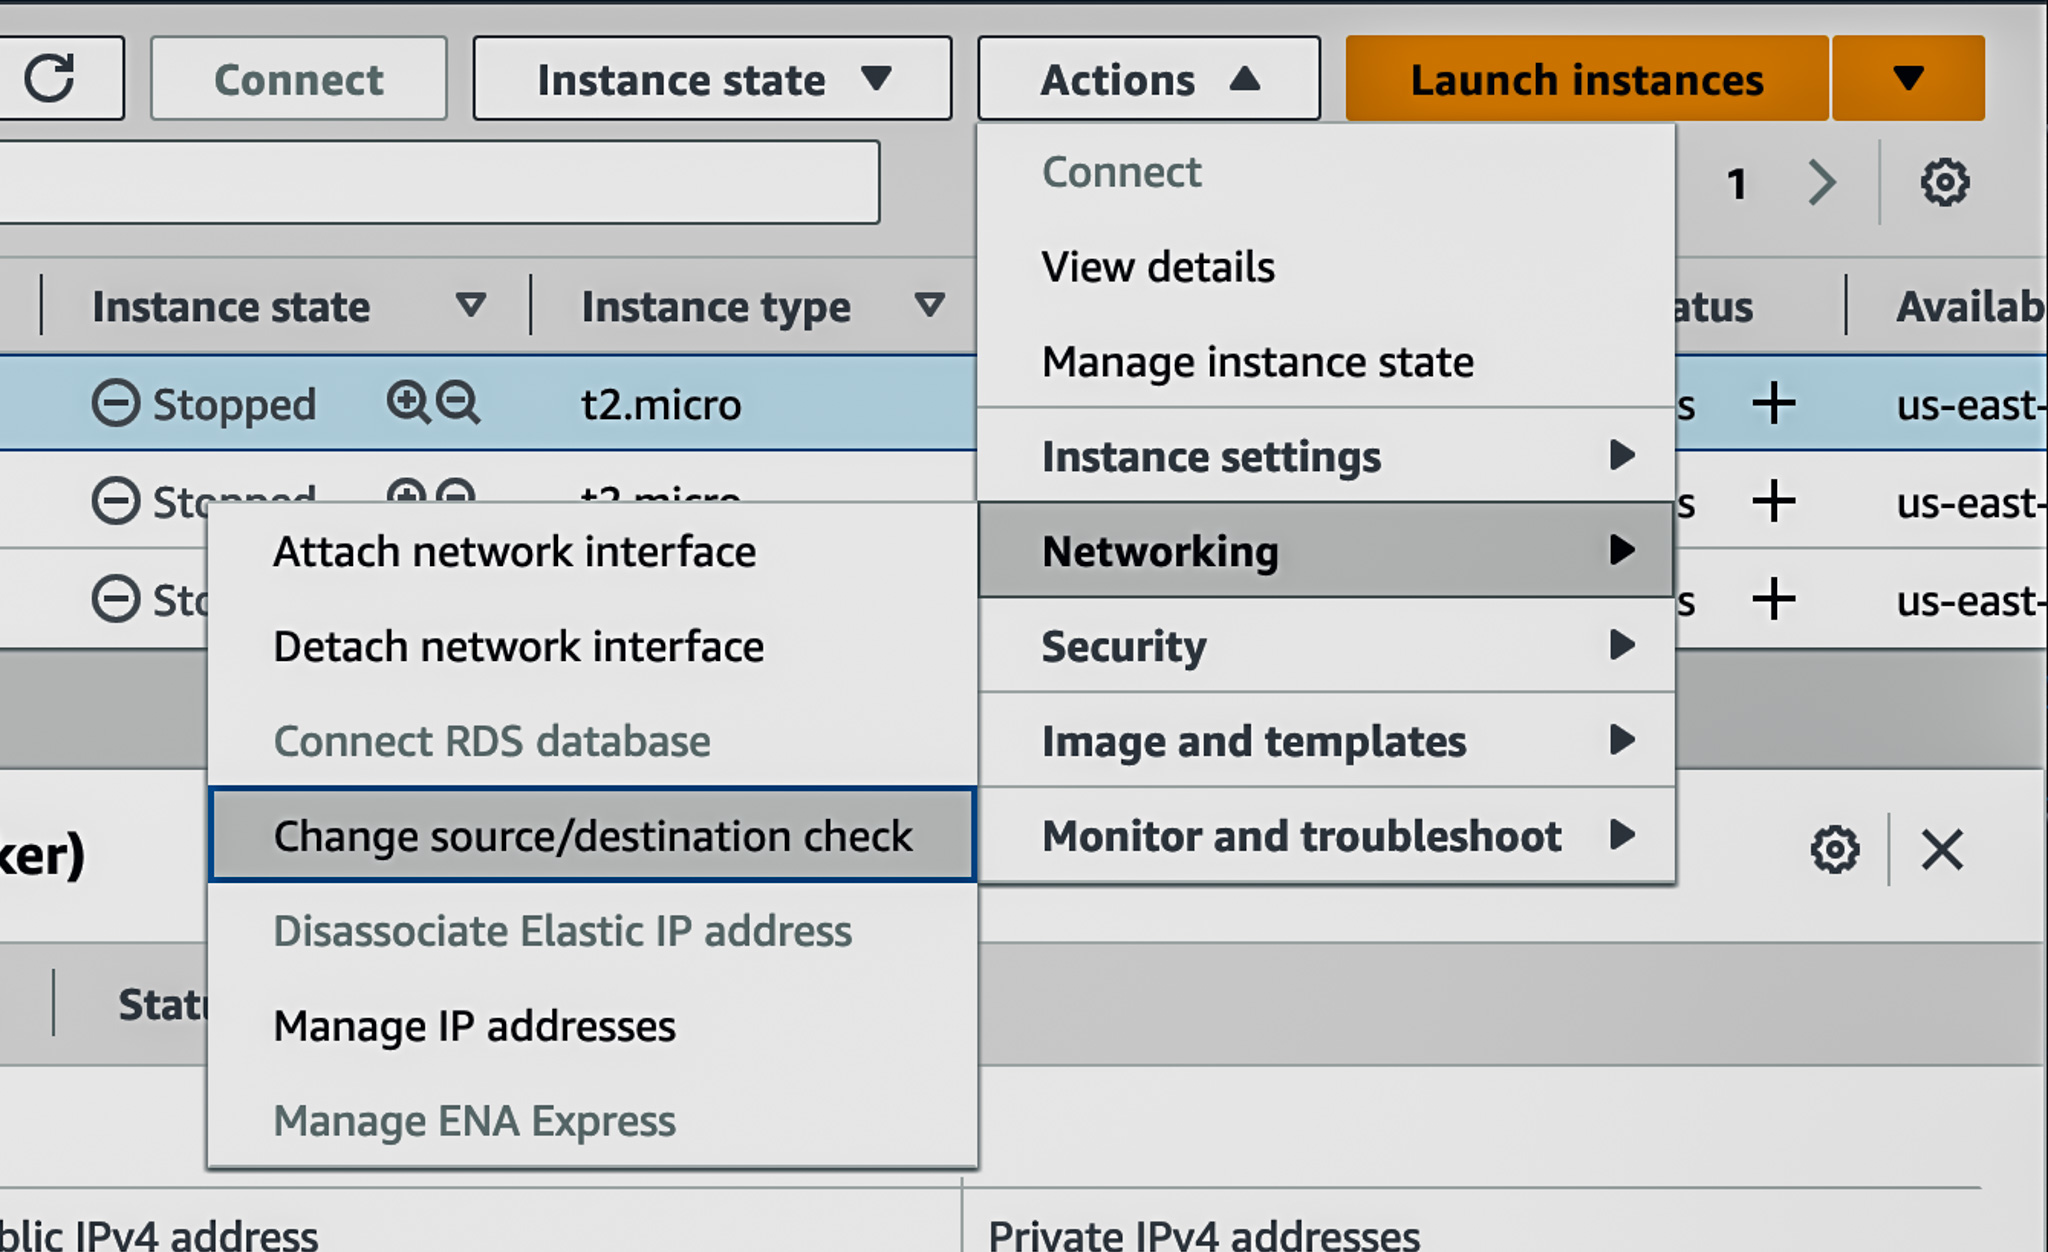
3. Disable source/destination checks for your router instance using.
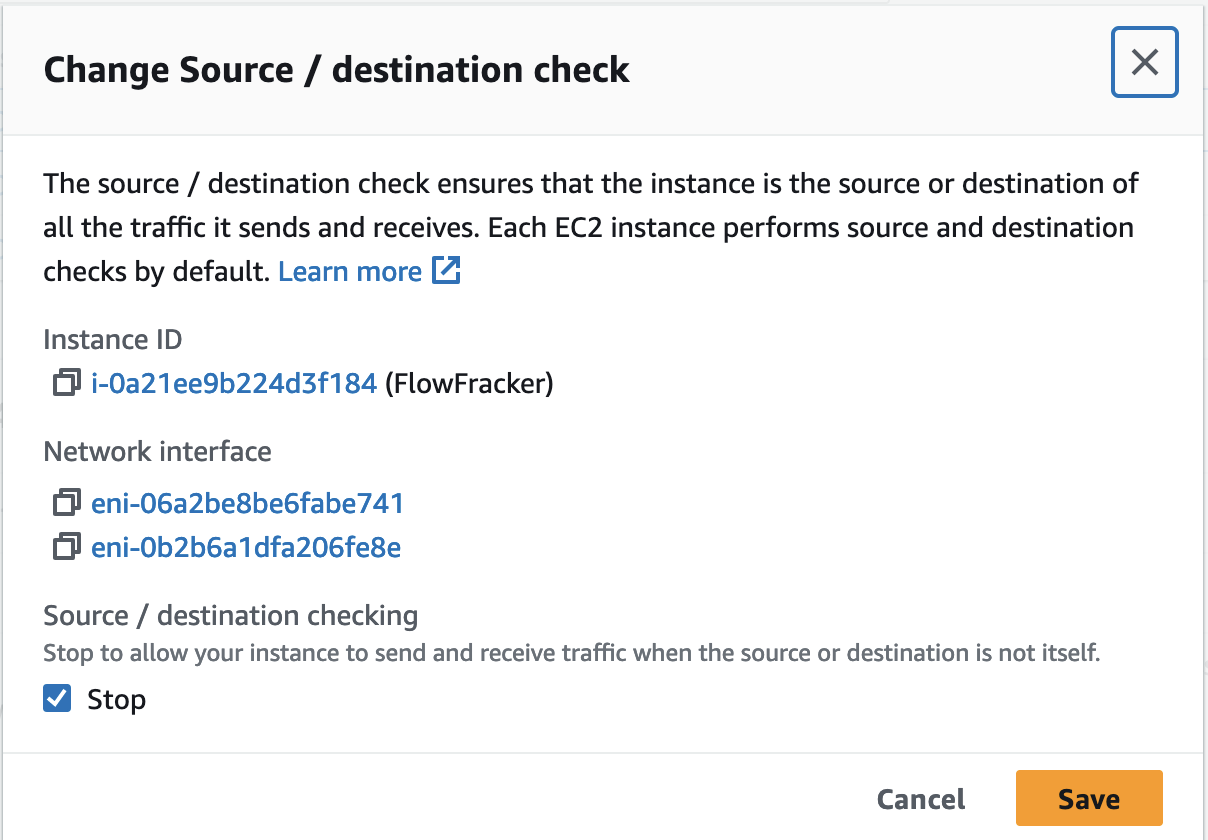
You can use the AWS EC2 console, or CLI. The images below show the AWS console options in the EC2 management console. Open the Change source/destination check in the menu, check the “Stop” option and click the “Save” button. If you forget to set this option, packets sent to your router, originating or destined for another host will be silently filtered.
4. Configure linux for ip forwarding
Ssh into your router host. Then run the commands below to enable ip forwarding, so the router host can act as a router. We also disable reverse path filtering. With properly configured routes this isn’t required, but it saves us a little configuration when it comes to the flow fraker interfaces, so I chose to disable this feature. Note, these settings will not persist between reboots.
sysctl -w net.ipv4.ip_forward=1
sysctl -w net.ipv4.conf.enX0.rp_filter=0
sysctl -w net.ipv4.conf.enX1.rp_filter=0
sysctl -w net.ipv4.conf.all.rp_filter=0
sysctl -w net.ipv4.conf.default.rp_filter=0
5. Configure basic routing
We will replace the original route with one that specifies the proper interface. We’ll add a route to our second network and interface, so our router knows where to forward packets destined for our server host and our client host.
ip route del 172.31.32.0/20
ip route add 172.31.32.0/20 via 172.31.47.218 dev enX0
ip route del 172.31.96.0/20
ip route add 172.31.96.0/20 via 172.31.103.30 dev enX1
At this point, if our router sees a packet destined for the client or the server, it should forward it onto the appropriate interface. Now we need to configure the client and server to communicate via our router.
6. Configure client and server
For the client and server, we simply need to make a change to the routing policy so that packets from the client to the server and vice versa route to our linux router. To do that, we can add a /32 route to the client and server. This means only packets destined for the exact IP address will route through our router, everything else will go through standard AWS routes. If you use AWS Transit Gateway, you can use this method to direct traffic through your router host to centrally manage your system without installing static routes on your application hosts.
7. Configure the client
Ssh into the client host and run the commands below to install our /32 route. Note the IP addresses will be different for your hosts.
#ip route add [server_ip] via [router_ip_1] dev enX0
ip route add 172.31.38.141/32 via 172.31.47.218 dev enX0
8. Configure the server
Ssh into the server host and run the commands below to install our /32 route. Note the IP addresses will be different for your hosts. Also note that our router ip address is different, because the server lives in a different network and communicates with the other network interface on the router.
#ip route add [client_ip] via [router_ip_2] dev enX0
ip route add 172.31.109.128/32 via 172.31.103.30 dev enX0
9. Test the routing
Start a ping from the client to the server. Then ssh into the router and use TCPDump to validate that packets are actually flowing through our router. Specify the interface, and filter for ICMP traffic so you see exactly what you are sending. This method can help you troubleshoot where a packet might be getting stuck.
tcpdump -i enX0 icmp
If you are seeing ping responses, and you have verified that the packets are showing up on the router interfaces, then you are all set for the next steps.
Flow Fracker architecture
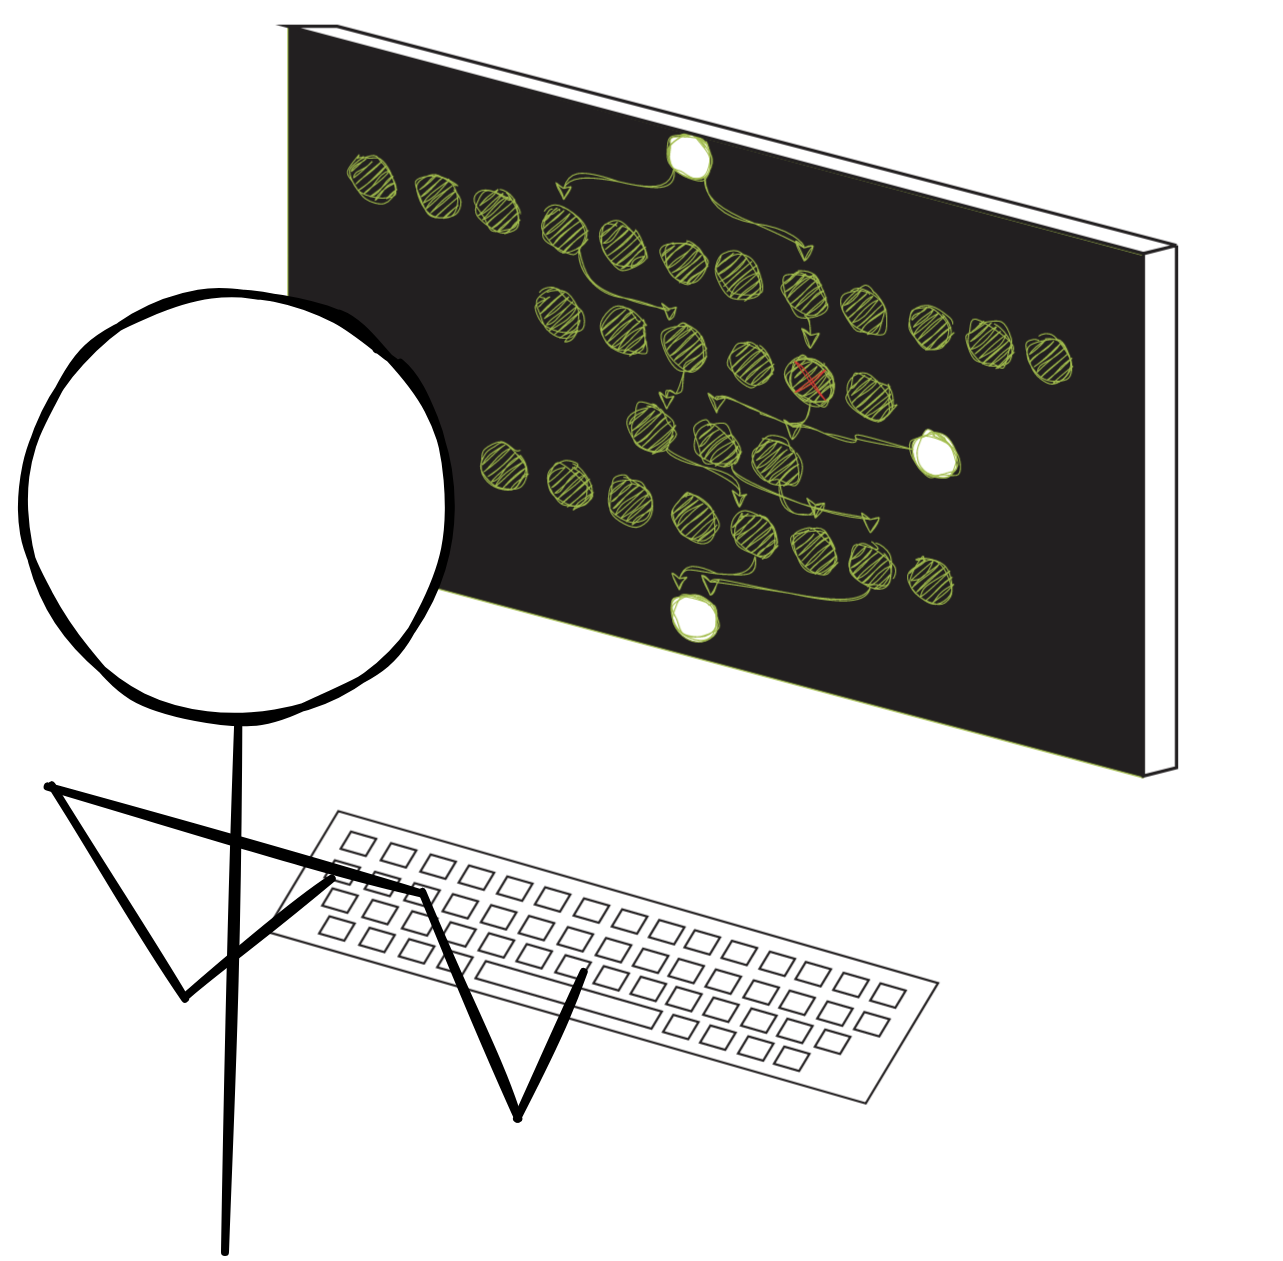
The next part of the article will walk you through adapting our simple linux router into a Flow Fracker, capable of simulating failures on a subset of network flows. Our end state will look like the diagram below. The trick is using a number of virtual interfaces, then setting up ECMP routes to those interfaces. This is a virtual configuration that mirrors large scale cloud networks. The number of interfaces we use simulates the number of devices or links on a given tier of a cloud network. If you want to simulate a network tier with three devices, create three virtual interfaces. If you want to simulate a tier with one thousand devices, create one thousand virtual interfaces. In practice, one hundred devices provides you with enough granularity to simulate failure on whatever percentage of flows between one and one hundred. For example, if you want to simulate 1 device failure in a 3 device tier, you simply enable tc of 33 of 100 of the flow fraker interfaces.
We’ll create a separate ffroute routing table with the ECMP configuration to forward packets to our virtual interfaces. We will use IPTables mangle rules to put a forward mark on the packets we want to use the ffroute table and flow through our ECMP interfaces. Without this bit, the Linux router would continue to do what it does, and just forward packets through directly to the interface on the destination subnet. Next, we’ll apply traffic control policies onto these virtual interfaces to simulate network failures. Finally, we need a network namespace to make a hairpin route to put the packets back into the main network namespace to proceed with the normal routing policies after we’ve run them through the failure simulator. The diagram below shows how these things work together.

Setup Flow Fracker virtual routing
This is where things get complicated. Our goal with this setup is to add our Flow Fracker interfaces in the middle of the routing policies we set up in the steps above. We need to create one hundred virtual interfaces to give us the ability to affect 0% to 100% of flows in 1% increments. There are some complications that prevent easy multi-hop interface routing on the same host. Fortunately, Linux virtualization features, specifically network namespaces, allow us to build multi-interface hops within one host.
1. Create a network namespace
We need a network namespace as a way to hairpin traffic back to the main network namespace, after we have applied tc routing policies. This is the magic that allows us to build multi-hop routing policies within one host. We also need to configure the new namespace to allow ip forwarding and need to disable strict reverse path filtering.
ip netns add ffnamespace
ip netns exec ffnamespace ip link set lo up
ip netns exec ffnamespace sysctl -w net.ipv4.ip_forward=1
ip netns exec ffnamespace sysctl -w net.ipv4.conf.all.rp_filter=0
2. Create enFF interfaces
We’re using veth type interfaces to interconnect between the main network namespace and our ffnamespace namespace. This is the command set I ran to set up one of hundreds of the FF interfaces. When I first set this up, I found the system was generating ARP requests without response, and packets weren’t routing through my enFF interfaces. Disabling ARP resolved the issue. The commands below disable ARP on both sides of the enFF veth interface. We must also remember to disable strict reverse path filtering on both network namespaces.
ip link add enFF0 type veth peer name enFF0 netns ffnamespace
ip addr add 192.168.0.1/24 dev enFF0
ip netns exec ffnamespace ip addr add 192.168.0.2/24 dev enFF0
ip netns exec namespace ip link set enFF0 up
ip link set enFF0 up
ip link set arp off dev enFF0
ip netns exec namespace ip link set arp off dev enFF0
ip netns exec ffnamespace sysctl -w net.ipv4.conf.enFF0.rp_filter=0
sysctl -w net.ipv4.conf.enFF0.rp_filter=0
Repeat this sequence, incrementing the ip addresses with each interface, one hundred times to get one hundred interfaces. When I first set up these interfaces, I found I was able to see packets on both interfaces. However, the namespace wasn’t routing the packets as I expected. I found a hacky method that works, but if you know of a better way, please send me an email or leave a comment. I found that setting the hardware addresses to match on each veth pair gets the ffnamespace routing logic to work as expected. To set the hardware address to match, I looked up the auto generated interface MAC address for one side and applied it to the other using a command that looks like this:
ip netns exec ffnamespace ifconfig enFF0 hw ether 92:0a:d3:ca:d6:1c
3. Create enFFOut interface
We need a path to route packets back into the main network namespace. I chose to create a separate dedicated veth interface for this purpose. I called it enFFOut. You’ll need to use the same create procedure as above, and you must also set the hardware addresses to match.
ip link add enFFOut type veth peer name enFFOut netns ffnamespace
ip addr add 192.168.0.253/24 dev enFFOut
ip netns exec ffnamespace ip addr add 192.168.0.254/24 dev enFFOut
ip netns exec ffnamespace ip link set enFFOut up
ip link set enFFOut up
ip link set arp off dev enFFOut
ip netns exec ffnamespace ip link set arp off dev enFFOut
ip netns exec ffnamespace sysctl -w net.ipv4.conf.enFFOut.rp_filter=0
sysctl -w net.ipv4.conf.enFFOut.rp_filter=0
4. Setup ffnamespace default routes
Any packets that end up in the ffnamespace should be pushed back into the main namespace via the enFFOut interface. We’ll do that by setting a default route.
ip netns exec ffnamespace ip route add default via 192.168.0.254 dev enFFOut
5. Add the ffroute routing table to the main namespace
You’ll need to add a new line to the rt_tables to allow you to configure the ffroute routing table.
#edit /etc/iproute2/rt_tables
Add the line below and save the file:
10 ffroute
/ect/iproute2/rt_tables
#
# reserved values
#
255   local
254   main
253   default
0     unspec
#
# local
#
#1    inr.ruhep
10 ffroute
~
"/etc/iproute2/rt_tables" 12L, 98B
6. Configure the ffroute table with basic default route
We will start simple as a way to make sure the basic path from the main namespace to the ffnamespace and back again is working before we add the ECMP route configuration. To do that, we’ll add a simple default route to one of our enFF interfaces.
ip route add default via 192.168.0.1 dev enFF0 table ffroute
7. Set ip rules for using the ffroute route table
Now we need to tell our router when to use the ffroute table. We’ll want any marked packets to use our special route table. We’ll set the marks using IP tables in the next step.
ip rule add fwmark 1 pref 10 lookup ffroute
8. Mark inbound packets with IP tables
You’ll need to install and set up IPTables to mark inbound packets. Setting this mark will hook into the ip rule we configured in the prior step. We also get rid of the rule that drops ICMP by default. This makes troubleshooting a little easier, but isn’t required.
yum install iptables-services -y
systemctl enable iptables
systemctl start iptables

iptables -t mangle -i enX1 -A PREROUTING -m mark --mark 0/0xffffffff  -j MARK --set-mark 1/0xffffffff
iptables -t mangle -i enX0 -A PREROUTING -m mark --mark 0/0xffffffff  -j MARK --set-mark 1/0xffffffff
iptables -D FORWARD 1 #Remove ICMP drop rules
9. Test your routes
At this point, all packets heading to your router should hop through the enFF0 interface, into the ffnamespace network namespace, then back out through enFFOut and onto the appropriate router interface of enX0 or enX1. I recommend you test at this point to make sure it’s all working. Setup your ping test from client to server again. Then use TCPDump to verify you are seeing packets on the enFF0 interface. If your pings are successful, and you are seeing the packets on the enFF0 interface, you are all set for the next steps.
10. Setup ECMP routes
With the end to end working, you can now activate all of your other enFF interfaces by replacing your default route to enFF0 to a default route that ECMPs to all of your enFF interfaces.
ip route replace default via 192.168.0.1 dev enFF0 table ffroute \
    nexthop dev enFF0 via 192.168.0.1 weight 1 \
    nexthop dev enFF1 via 192.168.0.3 weight 1 \
    nexthop dev enFF2 via 192.168.0.5 weight 1 \
    nexthop dev enFF3 via 192.168.0.7 weight 1 \
    nexthop dev enFF4 via 192.168.0.9 weight 1 \
    nexthop dev enFF5 via 192.168.0.11 weight 1
keep going till you add routes for all of your enFF interfaces
Set the ECMP policy to use the 5-tuple to match typical cloud provider configuration.
sysctl -w net.ipv4.fib_multipath_hash_policy=1
Setup traffic control to drop or delay packets
Phew! You made it. Now you have a simulated cloud network tier, but you are simulating the nominal case where everything is working. Now is the time to configure traffic control to simulate failures on a subset of your interfaces. Before we do this, there is some nuance you should know about.
As you are configured, the send path and the return path will route through you through enFF interfaces. The send path has a different 5-tuple from the return path, so they will independently hash to select a particular enFF interface. This means that you are rolling the probability dice twice for any connection. So if you set up 33% of your enFF interfaces to fail, you can expect 56% of your connections to fail.
The command below sets 100% packet loss on 3 of 100 enFF interfaces. Considering the send and return path, this means about 5.9% of connections will fail.
yum install iproute-tc -y
tc qdisc add dev enFF0 root netem loss 100%
tc qdisc add dev enFF1 root netem loss 100%
tc qdisc add dev enFF2 root netem loss 100%
You can find more traffic control options on this blog, including how to set delays, inject packet corruption and how to apply random distributions of impact.
Testing Options
Flow Fraker provides you with many options for testing failures. First, we will highlight a few of the new options at your disposal, then we’ll list out a recommended set of tests.
Semi-symmetric or asymmetric impact As configured above, both send traffic and return traffic to the client flows through Flow Fraker. You can change the IPTables configuration on the router to apply traffic to one direction or the other. For example, if you remove the mangle rule on enX0 interface, then Flow Fraker will apply only to return traffic sent from the server. You can use this to simulate various different scenarios.
Count the hashes to predict impact ECMP hashes the 5-tuple of a packet to select an interface. This happens once for sent traffic and again for return traffic. When you add tc failure injection on a % of the enFF interfaces, multiple hashes increase the probability that a particular packet will route through one of the impaired enFF interfaces. Please keep this in mind for your testing, because it can have a large effect on your results. 33% of enFF interfaces with simulated failure means the probability of a send or return path of a connection experiencing an impact is 56%. If you apply enFF routing to just sent or just return path, then each connection has a 33% of experiencing impact. If your application uses many connections, talks to many dependencies, then each time hashing occurs it increases the probability that the application will be impacted by your simulated failure.
This increase in probability of failure also happens in the real world. If a network tier experiences a partial impact, the more times your application has to transit that tier, the greater the probability of impact.
Use directed marking to test specific application functions Instead of random flow hashing, you can also mark specific packets using the same Flow Fraker approach. This is useful if you have a cluster service using a custom replication protocol that you would like to test. To do this, construct an IP tables rule that exactly matches the replication traffic. Then update the routing policy of ffroute to use just one enFF0 interface. Now you can apply tc policies to enFF0 knowing that you will impact the specific network packets you want to impact.
Test your application with simulated partial network failures. You might not know how your application will behave when network failures occur without testing. At a minimum, use testing to see how network failures show up in your monitoring. Ideally, you can use testing to refine your network configuration and application retry logic to automatically recover from network failure events. If you are running data clusters, generate representative read and write transactions whilst you run through the scenarios below. Some impacts may show up as increased write latency and reduced transaction throughput. So you’ll need that throughput to detect impact.
- Simulate device failures:
- Random 5% of connections increasing to 33% of with total packet loss
- Simulate network congestion:
- Random 5% of connections with 5% packet loss to 50% packet loss
- Random 33% of connection with 5% of packet loss to 50% packet loss
- Simulate data/state failures:
- Prevent ability to establish new connections
Conclusion
Flow Fraker allows you to simulate how cloud networks fail by applying traffic control network delay/loss/corruption to a random % of network connections. Use these tools to see how well your monitoring systems can detect partial network failures. You can also use this technique to test your load balancer or your database cluster’s ability to detect and recover from partial network failures.
Please leave a comment with any questions or feedback below. Thanks for reading!